The Microsoft Graph API library has been around since November 2015 and continues to expand. One of the key endpoints that has centered around utilization reports of the Microsoft 365 ecosystem. These reports can be leveraged to drive better overall adoption of the Microsoft 365 platform and understand trends in use.
Leveraging the Microsoft Graph API, the Microsoft 365 Utilization Metrics app has been the easiest deployed solution to work through this challenge. With a few clicks in AppSource, you can deploy this app within Power BI, update some details on the sematic model, and hit refresh to understand utilization. And while it does show data for the past year, customers frequently want more out of their data.
People forget about the Microsoft Graph API until new technology finds its way into the ecosystem. Enter stage left, Copilot for Microsoft 365, the newest belle at the ball! With new technology coming at a premium price point, companies want to understand utilization to ensure value. The $30 per user per month cost of Copilot suddenly has people wanting to confirm people are leveraging the tool. If not, they want to reclaim the license and get it to someone else.
This gave me the idea to revisit this challenge and see how we could leverage Fabric to make it a reality. While the Microsoft 365 Roadmap has this rolling out soon, a little preparation will allow you to deliver this data when it is finally available.
What are the Microsoft Graph API Reports?
The Microsoft Graph API reports are a collection of endpoints that provide utilization data for users. Aggregated by action, these reports provide visibility to how Microsoft 365 is leveraged. While you can pull data for users in 7, 30, 90, and 180 periods, the data is aggregated by user. This proves a challenge in getting data in a meaningful format if you are looking to track trends over time.
While those periods work, there is another option. Most endpoints allow you to specify an individual date for your query. However, you can only collect that data for the past 30 days. This is a huge restriction and can limit your ability to trend data over a longer period of time.
In the past, if you did not have a data warehousing strategy in place, you were severely limited to what Power BI could do. However, leveraging Microsoft Fabric, this will get you in the right direction pretty quickly. However, with the advent of Microsoft Fabric, we will be able to simplify this process and enable you to track this data with minimal effort!
Preparing Access to Microsoft Graph API Reports
To get ready for the data warehousing process, you must deploy an app registration inside of Entra ID. To get started, sign into Entra ID, navigate to Applications, select App Registration, and start a new registration. Name your new app and keep everything else the same:
Registering an app via Entra ID
Once you click register, copy the Application (Client) ID and Tenant ID from the overview page and save it for later. Next, go to API permissions and click add permission. You will select Microsoft Graph and then application permissions. From there, you will need to add the following permissions:
Permission Name
Purpose
User.Read.All
Provide dimensional data around users within your organization from Entra ID. While User.Read has already been added to the app, it will not work in this situation.
Reports.Read.All
Provides access to all reporting endpoints for Microsoft 365. This includes Microsoft Teams, SharePoint, OneDrive, Exchange, and Viva Engage
Details about API permissions for your app
Once these permissions are assigned, grant admin consent for your organization. The permissions you added should have green checkmarks next to them:
Admin consent granted for API permissions
Lastly, you need to generate a client secret. Go to Certificates & Secrets and add a new Client Secret. Once created, make sure you copy the value for your secret and save it. You cannot get it again and will need to re-create it when you are finished.
Turn off Report Masking
As a security feature, the Microsoft Graph API has user masking available for this data. This helps protect the anonymity of user activity in the tenant. However, if we want to track Copilot for Microsoft 365 utilization, we cannot be anonymous. For some of you, this will not apply. However, this process could require some approvals. Asking early will ensure you can the report mask turned off ahead of time.
To turn off report masking, go to the Microsoft 365 Admin Center and expand settings on the left side of the screen. From there, select org settings and then select reports. A panel will appear on the right side of the screen. Uncheck the option titled display concealed user, group, and site names in all reports:
Turn off the report masking in the Microsoft 365 Admin Center
It is important to note that this feature is either on or off for everyone in the organization for all reports. There are no granular controls for this feature. Therefore, make sure you understand the implications of turning off this setting and communicate it to fellow Microsoft 365 administrators who might be using these reporting features whether by API endpoint or in their respective administrator portal.
What else do I need to know?
This project will require you to understand how to use REST APIs in Dataflows. If you have not read my series on leveraging REST APIs in Power BI, this would be a good place to start. We will need to build a number of connections leveraging this method.
Next, we will have to navigate an authentication process that will require us to use the POST method. I have also written an article on navigating this challenge. This will be a little more complicated, but the code found in this article will be helpful for understanding how we will build a function to drive authentication for these endpoints.
Lasty, you will find yourself writing some M Query code. If you are new to this, the code will be provided to assist you. However, you will want to learn a little more about the language so you understand the method behind the madness.
Conclusion and Next Steps
This setup only takes a few minutes, but it will go a long way in preparing our environment. As mentioned above, if you are not familiar with using REST APIs in Power Query, please take some time to learn about them. I promise you that you will thank me later. This can get very complicated, so understanding the process ahead of time goes a long way!
This will be enough to get thing started for right now. In my next article, we will explore setting up our Fabric environment to query this data and prepare it for the data warehouse.
In preparing for the Global Power BI and Fabric Summit this year, I got a little nostalgic. I went back to my presentation and early blog posts on connecting to REST APIs. Two years, several blog posts, and a book on Power Query later, I felt it was time to add a fifth part to this series. I realized that I left out one additional step I could take to optimize my query a little more to allow me to squeeze the most out of my API call limits.
I will be picking up where we left off with part 4 of how to connect to data with REST APIs. However, if you are new to my blog, you can start from part 1 and get caught up. If you recall, I am limited to 100 API calls a day with my scenario. If I am watching more than 100 stocks, I might need to consider moving to the next subscription level. However, I have an option to squeeze even more out and potentially return 1,000 stock symbols. This is a bonus as I do not need to increase my subscription!
What Did Dom Miss in Part 4?
To note what I missed, I need to go back to part 2 on REST APIs. You must Read the Fine Manual! In reading the documentation, I realized that I could batch multiple stock symbols at once. Instead of making individual calls for each symbol, I can group ten of them in a single call.
Guess I need to take my own advice?
With this knowledge in hand, I set out to take my query one step further and get more out of my subscription. It is not as straight forward as it may seem, but with a little manipulation we can make it work.
Prepare my List
We already have a spreadsheet of stock symbols we have brought in. We need to do start by removing all of the columns except the stock symbol. Just right click on the symbol column and remove other columns. Once that is complete, insert an index column that starts from 1. Your query should look like this:
Make sure your index starts from 1!
Next, we need to add a batch column. We will need to identify every 10th row and assign it an index number. We will need to create a custom column for this. Using a modulo division function, we will identify every tenth row. If it is the tenth row, the remainder will be zero. If the modulo division equals zero, we will divide the index by 10. Otherwise, we will return a null value. The formula looks like this:
if
  Number.Mod([Index], 10) = 0
  then Number.IntegerDivide([Index], 10)
  else null
Next, we just need to use the fill up feature to make sure the rows are assigned to a batch. The last few rows will still be null. This is not an issue as it will still be its own batch. The result looks like this:
Our stock symbols associated with a batch
With our batch in place, we can remove the index column. Next, we need to group our symbols together.
Use Group By to Bring Symbols Together
Going back to our documentation, each symbol must be separated by a comma. We will use the group by function to bring ten rows at a time together into a single column. We will select our batch column and select the group by function in the transform ribbon. Using the sum aggregation, we are going to summarize our symbol column. Naturally, this will result in an error, but we will fix that next.
Setting up the group by function
Next, we will need to update the M code in the advanced editor. We need to replace the List.Sum() function with the Text.Combine() function. Our code for this step will look like this:
Table.Group(#"Removed Columns", {"Batch"},
  {{"Symbols", each Text.Combine([Symbol], ","),
  type nullable text}})
The result an updated query with our stock symbols combined:
Stock symbols combined in a single cell by batch
Now that the hard part is over, we just need to apply our function.
Functions and REST APIs
We already created a function in part 3 of my REST APIs series. We just need to apply it to our new query. Go to the add column ribbon and insert a column from function. Using the symbols column for the parameter, we can query all of the symbols in the cell.
Invoking the Get-StockInfo function
All that is left to do is expand the results so they can be leveraged in the model:
Stock data from our endpoint
And just like that, we turned twenty five API calls to three. Not too shabby!
Conclusion
It is extra work, but it is worth while if you can save a few dollars and minutes with your refresh. It may seem excessive, but it might make the difference. Besides, I could not resist a post where I tell people to Read the Fine Manual as I know my friend Mike will get a good laugh out of it again!
Have you ever used the group by function in Power BI? Or ever extended like this? Did I miss another way to optimize this query? If so, tell me in the comments below!
The word parameters is a little ambiguous when it comes to Power BI. I have written a number of articles that reference parameters, but never took the time to clarify their use cases. I wanted to dive in to the different types of parameters and understand the best way to use them. Paired with some tips and tricks, you will have a better idea of how to use all kinds of parameters in your reports.
Parameters in Power Query
In my opinion, parameters in Power Query are the most in your face. When you launch the Power Query editor, there is a button on the home ribbon that helps you manage them. But have you ever used them?
Parameters in Power Query allow you to add reusable values in your queries. The premise is simple – if you keep using the same value over and over again, why not make it easy on yourself?
How to Leverage It
To get started, open the Manage Parameters window in Power Query. From there, create a new parameter and give it a meaningful name. From there, you just need to specify the type of value, add your value, and click OK. Since I am creating a parameter for a reusable API key, I am just using text and adding in my key.
Creating a Parameter in Power Query
Now that I have the parameter in place, I can use it in an existing query. Since I was looking to easily reuse an API key, I can go and update my queries.
Leveraging my Parameter with Another Query
As an added bonus, I can share my full query without having to remember to hide my API key!
Common Use Cases
While the API key use case above is one of my favorite stories to tell, there are a few other key use cases.
One of the most famous use cases is when you need to create parameters for Incremental Refresh or Hybrid Tables. You need to create a RangeStart and RangeEnd parameters to setup the filtering on the report.
Another great use case is when you need to quickly change values to filter a report. In a past life, I worked for a company that had APIs for external reporting. Since customers always wanted similar reports, I created them with parameters so I could quickly update the API key and customer id. When a new customer wanted a custom report, I just updated the parameters to get their data in, made some adjustments, and sent the report out.
Tips and Tricks
Tip #1 – If you save your Power BI Desktop file (PBIX) as a template (PBIT), you will be prompted to enter the parameters when you use it. This helps save you a few clicks.
Tip #2 – All of your parameters can easily be updated in the Power BI Service without having to open the desktop file. Go to your data source settings and you will find the parameters section. This allows you to update your parameters like API keys with minimal effort.
Tip #3 – If you are using a deployment pipeline, you can easily swap between your Dev-Test-Prod databases. Just set parameters for your server and database fields in the advanced editor window and update them in the Power BI Service.
Function Parameters
Not as common of a use case, but functional parameters allows you to reuse a query quickly. I go into great detail on why to use functions with my article on how to use REST APIs in Power BI, but in short, they allow us to scale a base query rapidly.
How to Leverage It
One of my favorite endpoints pulls stock information by ticker symbol. I could build multiple queries and append them, but a function makes it easier. I just need to add a little code at the top to convert my base query to accept a parameter.
Parameters in a Power Query Function
I specified the parameter that I wanted to gather and then apply it in the query. When I go to use the function, I will be prompted to specify the parameter so the query works properly.
Common Use Cases
I frequently use function parameters with APIs. Because some API endpoints require dynamic values, you will need to iterate with a function like I did with the stock symbols.
Another common use case for me is building common elements I might use in a report. If I am running into queries that are using paging , I can grab a function and invoke it to build out my base. Another common use case is to build out a date table when one is not available in my data source. Of course these are things we want to do as far upstream as possible, but if you are not in control of your database, you might need to create your own.
Tips and Tricks
Tip #1 – Invoking a function as a column is an easy way to specify your parameters with existing column values. The function will run on each row of your query using the values in the columns identified. It is a quick and easy way to apply a function!
Tip #2 – You can edit a query and add a function by hand. Just make sure you specify your parameter in the function or it will not work. I use this all the time for token based authentication with APIs.
Tip #3 – If you are using a few different API endpoints, you can create a base function to handle the majority of your query. Just add a parameter to the function to specify the endpoint. From there, you can add your endpoint or table name in the parameter field and invoke the function which speeds up your connection time.
What If Parameters
What if parameters are different than the other two parameters we discussed. Power Query and function parameters really help us with querying data efficiently. What if parameters are all about what you could do with your data.
How to Leverage It
We often find what if parameters when you want to run some simulated scenarios. I recently did a deep dive on what if parameters, but at a high level, we have two components.
The first component is the creating the parameter itself. We will go to the modeling ribbon and select new parameter. A new window will open and I can specify key components of my parameter which include the name, data type, minimum, maximum, increment value, and default. Once I click OK, a new slicer will appear.
But that was the easy part. We now have a new measure that is <Parameter Name> Value. This brings back the value you selected in your parameter. We now can use this measure in a measure to get our value. You will need to use a little DAX, but it is worth the extra effort.
Common Use Cases
The most common use case is to simulate revenue increases. I add the parameter to a formula that takes their current revenue and shows the change. Everyone is trying to make more money, so it makes sense.
One of my favorite use cases is to help filter data. I built a report that compared property assessments in my town. I used a what if parameter to help filter 3,500 properties to only a handful. Using key values such as year built, livable square footage, and lot size, the parameters found similar houses to the one I selected. Instead of having to fool around with filters, I could just quickly adjust my report parameters instead.
Tips and Tricks
Tip #1 – Always have the parameter make the slicer when you can. You can hide it in the selection panel if you don’t want to use it, but the slider is so nice. It makes the mobile experience even better!
Tip #2 – If you are using a number of parameters, don’t be afraid to create a page for your parameters. You can just sync the slicers to other report pages. This prevents clutter and speeds up load time for a page sine there are less objects in the view.
Tip #3 – You can create your own what if parameters with a custom table. This is nice when you want to use a non-numeric parameter. This is a common practice for filtering reports on things like top/bottom views.
Parameters on Parameters
You might have gotten to this point and said “Wow – I had no clue that this term is so widely used!”. I think it is important to understand the different kinds of parameters because they really can make an impact on your reports. Some of my reports maybe only use one of these while others use all three. The key is understanding how to properly use them.
Have you used any of these parameters before? Do you find them helpful in your report design and data models? If so, tell me in the comments below!
We all want to hone our skills, but sometimes struggle to find good sample data sets to try out new ideas. Sometimes it is about specific data structure or maybe you want to show off an idea but cannot use production data. A lot of what I share comes from real scenarios I have encountered. To share these tips, I have had to use different data sources over the years.
This week, I want to share some data sets that I find fun and helpful for trying ideas out in Power BI. Some will be easier to use than others. You might even need to have a SQL Server to make them work. Regardless, you should be able to find something you can use.
The Most Basic of All Sample Data Sets
If you are brand new to Power BI, the Contoso Financial Sample workbook is a great place to start. It is a free and easy to use data set for beginners. While it does not a great resource for data modeling, it does serve as a quick and easy model to learn the basics of Power BI.
When I was a Power BI trainer, I liked using this data set for basic DAX calculations as some of the key measures such as cost of goods sold (COGS) where included in the model. I can perform some basic calculations which result in net profit.
Check out the Contoso Financial Sample data set here.
Learn How to Find Insights
Another one of my favorite sample data sets that is easy to use is the Pima Indians Diabetes Database from Kaggle.com. Like some of you, I cringe typing out the name of this data set. If published more recently, it would have likely been given a more culturally sensitive name. However, I use this data set for demonstrating the key influencers visual. I have also used it for predictive modeling with Azure Machine Learning, but that is for another day.
This data set was assembled by the National Institute of Diabetes and Digestive and Kidney Diseases. The purpose of the data set was to perform predictive modeling on diabetes in the Pima community. Identified as a high risk population for Type 2 Diabetes, this data represents the Pima community through years of research. Kaggle provides this data set for free. You just need to sign up for an account to access it.
Kaggle is a great resource for other data sets. There are so many to choose from, it is hard to just pick one. However, you are welcome to peruse their catalogue as you might find something interesting. With a little searching, you will find a data set which you can use to build a report on Settlers of Catan!
Check out the Pima Indians Diabetes data set here.
Simplest of SQL Sample Data Sets
Adventure Works is likely the world’s best know SQL database.. A common data set used for training, it is easy to implement. Experience with SQL Server Management Studio will serve you well as you implement this data set. Microsoft provides clear instructions on restoring the database but I find a little extra know how helps. It is wise to make friends with a database administrator if you don’t have one. Offer to buy them a drink or two at happy hour for their help and you will probably make a new friend out of the experience.
Fans of The Office rejoice! TDMitch created a Dunder Mifflin sales data set from the Northwind Traders data base by Microsoft. Just like Adventure Works, this is a SQL data set. Implementing this data set requires additional effort compared to the Adventure Works database. You must follow instructions and run a few SQL scripts to finalize the setup of this data set.
I recommend this data set for someone who is trying to make something that connects with end users. I also recommend this data set for people who are expanding their transact SQL knowledge.
REST APIs are great resources for 3rd party data. They work well but you might find frustration with implementing them. I have used this data set before with my series on the Basics of REST APIs in Power BI. While each API endpoint is unique, you can capture the basics using the Yahoo Finance API.
Offered for free up to 100 calls per day, it is an effortless way to learn the basics with no costs. If you are really into stocks, you might even consider purchasing a paid subscription. Spend some time digging through the endpoints and become comfortable with how you can use APIs with Power BI.
You can review the Yahoo Finance API documentation here.
Big Data Sample Data Sets
Sometimes you want to throw a lot of data to test out a solution. The New York City Taxi data set is a massive trove of data that is free for use. Available as CSVs or APIs, you can choose how you want to access the data. I used it to benchmark refresh speeds between various Azure data sources such as blob, table, data lake, and Azure SQL storage solutions.
The Taxi and Limousine Commission provides quality documentation around the data set. It even provides clear descriptions in the data dictionary, maps of taxi zones, and dimension tables. It even explains the difference between yellow taxi, green taxi, and for hire car services.
Check out the NYC Taxi and Limousine Commission data mart here.
Did Not Find Something To Fit Your Needs?
No fear about that! There are tons of free data sources out there for you to use. My favorite place to go is to data.gov and check out different data sets available from the US Federal Government. You can also search for open data from many states and cities. You might even be able to use it for some of your solutions.
Google also has a data set search that will help you find some samples. Search for different topics such as commodities or labor statistics and see what comes back. My only caution is that not every result will be free. However, if you are looking for something specific, this search will help you find what you data you need.
How about you? What are some of your favorite sample data sets? If you have a good one or used one of these, tell me in the comments below!
Earlier this week I spoke about the Basics of Connecting to REST APIs at the Global Power BI Summit. A lot of people found it valuable, but wanted to know more about how to use the POST method to get data. Specifically, they wanted to know how to add a payload with the request to make it work. Since there was a lot of interest, I decided to write an article on this topic and share it with everyone.
For this article, I will be using the Microsoft OAuth2 endpoint to get an authorization token. You can find detailed documentation on the endpoint here. I will not be going into the details of the process to create an app registration or apply it in the Microsoft environment as that will take some time to cover. Instead, I decided to focus on the most important part of the request – the POST Method!
No/Low Code No More!
For many, this will be the scariest part of the entire process. This might be your first time ever writing code for a query from scratch. We do not have a connector to help us with this process. Fear not as we will walk through this entire process together and break it down. So to get everything started, go to Get Data and select Blank Query.
Adding a Blank Query to your report.
Once you select Blank Query, you will be redirected into Power Query with a blank canvas. I like to quickly update the query name on the right hand side before I forget. I am calling mine “Get-AuthToken”. Once that is in place, we will open up the Advanced Editor in the home ribbon. That is where the real fun will begin…
POST Method Query
Now that the Advanced Editor open, we are going to start writing out the query. We will need to write out a web connector query and a message body to make this work. I like to start with the web connector and build out from there.
Building the Initial Connection Query
Currently, we have Source = “” in our editor window. Those quotes are going to be the base of our query. We are going to start by adding the endpoint url in between the quotes. We should see something that looks like this:
let
    Source = "https://login.microsoftonline.com/<TENANTID>/oauth2/v2.0/token"
in
    Source
In order to specify how we are connecting to the endpoint, we will wrap it with Web.Contents:
let
    Source = Web.Contents("https://login.microsoftonline.com/<TENANTID>/oauth2/v2.0/token")
in
    Source
After that is in place, we need to add our headers. These are specified in the documentation and will be unique to your API. This example uses two headers and they are required to achieve the desired result. Note the comma between the url and the headers.
let
    Source = Web.Contents("https://login.microsoftonline.com/<TENANTID>/oauth2/v2.0/token", [Headers=[Accept="application/json", ContentType="application/x-www-form-urlencoded"]])
in
    Source
Lastly, because the header is specifying the response in JSON, we will wrap the entire string with Json.Document to translate the response.
let
    Source = Json.Document(Web.Contents("https://login.microsoftonline.com/<TENANTID>/oauth2/v2.0/token", [Headers=[Accept="application/json", ContentType="application/x-www-form-urlencoded"]]))
in
    Source
With that code in place we have our base query built. If you want to save some typing, you could always use an existing query as a template. Just copy and paste it into the blank query and make your changes.
Now that we have the base query written out it is time to focus on the message body.
Body Building without Protein
The body comes by a few different names. You might see it as message body, query, payload, or simply “The Data”. Essentially, it is additional information that is passed so the endpoint works as expected. While you don’t have to lift weights for this step, you might find it just as frustrating. I have tried this a few different ways, but found this to be the easiest method.
The first thing we will do is create a line right above our Source line and below the let line. From here, we will enter ContentBody = “”, as a place holder. Make sure you add the comma at the end of the line!
let
    ContentBody = "",
    Source = Json.Document(Web.Contents("https://login.microsoftonline.com/<TENANTID>/oauth2/v2.0/token", [Headers=[Accept="application/json", ContentType="application/x-www-form-urlencoded"]]))
in
    Source
My example requires five different fields be specified in the body. The formula is simple: field name = field data. We will add an ampersand at the end of the line and return to the next line to make it easier to read.
let
    ContentBody =
        "Content-Type=application/x-www-form-urlencoded&
        scope=https://graph.microsoft.com/.default&
        grant_type=client_credentials&
        client_id=<CLIENTID>&
        client_secret=<CLIENTSECRET>",
    Source = Json.Document(Web.Contents("https://login.microsoftonline.com/<TENANTID>/oauth2/v2.0/token", [Headers=[Accept="application/json", ContentType="application/x-www-form-urlencoded"]]))
in
    Source
As a best practice, I keep elements that might need to be changed at the bottom for easier access. This example leverages a client secret that will need to be updated over time. To make it easier to access, I leave it at the bottom.
Add the Body to the Web Connector
To finalize your query using the POST Method, you have to add the message body to the source line. We need to pass the body as content. However, I need to convert it into binary. We are just going to add Content=Text.ToBinary(ContentBody) inside of the first set of brackets so it passes the body in the web connector.
let
    ContentBody =
        "Content-Type=application/x-www-form-urlencoded&
        scope=https://graph.microsoft.com/.default&
        grant_type=client_credentials&
        client_id=<CLIENTID>&
        client_secret=<CLIENTSECRET>",
    Source = Json.Document(Web.Contents("https://login.microsoftonline.com/<TENANTID>/oauth2/v2.0/token", [Content=Text.ToBinary(ContentBody), Headers=[Accept="application/json", ContentType="application/x-www-form-urlencoded"]]))
in
    Source
Now that everything is in place, we can click Done and let the query do its magic!
Response from my POST Method query that brings back an access token for authentication.
To take things to the next level, I can drill down on the actual token by right clicking and selecting drill down. Next I will convert the query to a function by adding ()=> above the let line. In doing so, I will be able to leverage it for multiple endpoints that require token based authentication with a simple call.
()=>
let
    ContentBody =
        "Content-Type=application/x-www-form-urlencoded&
        scope=https://graph.microsoft.com/.default&
        grant_type=client_credentials&
        client_id=<CLIENTID>&
        client_secret=<CLIENTSECRET>",
    Source = Json.Document(Web.Contents("https://login.microsoftonline.com/<TENANTID>/oauth2/v2.0/token", [Content=Text.ToBinary(ContentBody), Headers=[Accept="application/json", ContentType="application/x-www-form-urlencoded"]])),
    access_token = Source[access_token]
in
    Source
Make Life Easier with Parameters
I plan to write a more detailed article on Parameters inside Power Query but I want to share a little tip that will make your life much easier. With this example, we are connecting to an app registration inside Azure Active Directory through a Client ID and Client Secret. The Client Secret will expire at some point and needs to be refreshed. To make your life easier, you can add your dynamic values as Parameters so you can update the query quickly.
Go to your home ribbon and click Manage Parameters. Click new and add your parameter name. Lastly, add your parameter value and click OK when finished.
Setting up parameters to simplify the process to update my client secret.
Now we just need to replace the values in our query. We will have to use the ampersands to concatenate our values together so they come together in a single string.
Now if I need to update my client secret, I can just update the parameter instead of breaking open the Advanced Editor. I can even do it from the settings view in the Power BI Service. But that will have to wait for another article.
Final Thoughts on the POST Method
It is important to note that not all POST Method endpoints are meant for querying in Power BI. The primary purpose of the method is to create items. However, it is not unheard of for querying rows of data. Before you do anything with an endpoint that uses the POST Method make sure you review the documentation. You might accidentally write data to your endpoint if you are not careful!
Do you have a use case for querying using the POST Method? Any favorite endpoints? If so, leave a comment below!
In my last article, I shared how to scale a query by using a function in Power Query. However, I noted there might be some challenges with this approach and considerations you should keep in mind when connecting to REST APIs. Some of these considerations are simple and are similar to normal query optimization activities. While not as technical as other articles, I feel it is important to take some time to focus on potential challenges you might encounter when leveraging REST APIs.
Limits, Throttling, and Speed
When reading your documentation, you might see words such as “limits” and “throttling” and wonder what they are. You will build your report and everything will be fine until one day your refresh fails. In reviewing the refresh errors it will suddenly make sense what “limits” and “throttling” mean.
To ensure APIs are not overburdened, limits and throttling are employed to prevent abuse. This protects the endpoints and provides a reliable service. Understanding how to navigate them are essential to prevent your refreshes from failing as your solution scales.
What are API Request Limits?
API limits restrict the number of calls made in a day, week, or month. If you signed up for the Yahoo Finance API, you notice they have three tiers of membership. The free tier limits your calls to 100 per day. Because of how we built our function, you would have to limit your report to 100 stocks and only refresh it once a day.
Now there are additional tiers that you can purchase which increase your limits. The Yahoo Finance API offers tiers that give you 20,000 or 75,000 calls per month which might help accommodate your use case but requires an additional financial investment. But even if you increase your subscription, note that these tiers still have a hard limit. Meaning that you might need to keep purchasing a higher tier if you blow through your request limit.
Subscription pricing and limits for the Yahoo Finance API (as of February 2022)
To be a good steward of your subscription, you will want to regularly monitor your API usage and verify that you are not burning through your quotas too quickly. It never fails – you run out of requests just when you need the data the most.
What is Throttling?
APIs use throttling to protect endpoints from being heavily queried over a short period of time. Queries are limited to the number of calls made per minute, per 15 minute window, or per hour. This protects endpoints from rogue code that could degrade the service because of abuse.
With the Yahoo Finance API, our documentation states that there is a rate limit of 300 calls per minute. If you had a list of 1,200 stocks it would take at least four minutes for the refresh to complete. (1,200 stocks divided by 300 = 4 minutes) Just like how every API is unique, they manage throttling differently.
In case you missed it above, you can see the rate limit for each subscription tier.
Last year I built a Power BI report that leveraged Google’s mapping APIs to get coordinates and street views of addresses in my town. Google enacted throttling to limit requests to 100 per minute. When refreshing my data, I hit my 100 request limit and the API paused until the full minute had passed. In doing so, I was able to proceed with the refresh. With 3,500 houses in town, it took 35 minutes for the refresh to complete. It was slow, but it worked great.
On the other side of the spectrum, the Microsoft Graph APIs have a limit of 10,000 calls per 10 minute period. When I ran over this limit, instead of the API pausing, I ended up receiving responses with a 429 error stating I reached the throttling limits. In order to manage this, I had to get a little more creative with my query to make sure I did not receive that error.
Impact on Refresh Time
Regardless of limits, you will need to consider refresh time when using REST APIs. If your primary data sources reside in SQL servers, this will be an adjustment for you. Normally you just cast a wide net with your query and bring in everything you can and work from there. With APIs, you want to narrow that scope to only what you really need. But with REST APIs, the refreshes tend to be slower. Adding some filtering will speed up your queries and make them more efficient.
If you are in a situation where you need a large amount of data from an API, you might want to consider leveraging Azure Data Factory or Databricks to incrementally replicate that data into a data warehouse instead.
Paging Queries
For this series of articles, our endpoint was fairly basic. It only brought back one row of data for each stock symbol. This was by design because our overall goal was to cover the basics. As you explore other APIs, you might find endpoints that bring back several rows at a time.
If you expand your horizon with REST APIs, eventually you are going to run into something called paging. Simply put, paging is the splitting of responses over multiple queries. Similar to limits, this is to prevent overburdening the endpoint with your query.
As an example, let’s say you are querying an endpoint that has 50,000 records. Paging has been enabled on this query and is limiting the responses to 1,000 records at a time. In order to receive all 50,000 records, you will need to build logic into your query to pull each page individually.
So how do you know your endpoint is using paging? It is all about the documentation. If an endpoint has pagination, there are usually a few parameters that will tip you off. If you see a parameter called “PageNo”, “PageSize”, or “Top”, you could run into paging.
It is also important to consider that you could avoid pagination with quality filtering. If your request is targeted and removes the noise of other records, it could avoid this problem all together.
In the coming weeks I will be doing an article specifically on paging, so keep an eye out for it!
Token Authentication
Another challenge you might encounter is token based authentication. Instead of passing an API key for authentication, you would need to call another endpoint to receive a token. Once you have the token, you would pass it through a header.
If you encounter this situation, you would need to create a function in Power Query that would solely return a token. While it takes a few extra steps, it is likely reusable with other endpoints in your report. In addition to that, it will simplify your query code and keep it tight and compact.
Conclusion
Congratulations for making it to the end of this series. There are a lot of challenges when implementing REST APIs as a data source but the juice is worth the squeeze. Taking yourself out of the mix and automating my refreshes is the end goal. And while the experience may not be as efficient as a SQL data source, it still gets the job done.
Have you been following along? Were you able to successfully connect and extract data from Yahoo Finance? How about other REST APIs? Let me know in the comments below!
In my last article, I showed you how to connect the quote endpoint from the Yahoo Finance API to Power BI. By leveraging the documentation and using copy/paste, we successfully connected to the API without a single line of code. In our review of the outcome we noted that our response only brought back data for a single stock.
While helpful, we know you probably want to refresh data for more than one stock. In fact, I happen to have a list of stocks that I am currently watching:
A list of stocks and when I wish I had bought them back in the day.
My next challenge is to take my original query and make it sustainable for however many stocks I have on my watch list.
Options are Plentiful
As with every Microsoft product, I have several different ways that I could manage this challenge. All have their benefits and drawbacks. Let’s look at them each and see which one would work best for my scenario.
Option 1 – Append Individual Queries
The first solution you might have considered is building a separate connection for each of the individual stocks we have in our list. Each query would be individually created and then appended into a master list so that way it stays organized. This solution would work and be effective, but there are drawbacks.
First of all, the biggest draw back is that I have to manually create this query each and every time I want to add a new stock. This does not take a ton of time, but it would require a few minutes of effort each and every time. Not a big deal if you only need to add one or two stocks to the model but it would add up with 20-30 stocks.
The other drawback is that you will have to continue managing the data model. If the list of stocks is dynamic, that means you either need to create a single model with every single stock in it or continue to manage it over time. This is not really sustainable as new stocks enter the market on a regular basis and requires manual maintenance.
Option 2 – Go Back to the Documentation
Sometimes you have some options when it comes to your endpoints for expanding your query. If we go back to look at our documentation for the quote endpoint, you will see that we can specify up to 10 stock symbols in our query.
Note that our API documentation says you can select up to 10 stock symbols all separated with a comma.
Perfect! So instead of having to write out 25 separate queries, I can condense it all into three. That is much more manageable and efficient! Well – almost more efficient…
Remember what I stated above – because we are still specifying the stock symbols for each query we still have to manually intervene every time we make a change to our stock list. This could get difficult especially as we go to maintain our list over time as we might need to remove stocks later. As a result, we will spend time searching for which query to resolve.
Option 3 – Scale Out our Original Query as a Function
The last option we have is to make our current query scalable. How do we make a query scalable? By converting it into a function.
Functions allow us to reuse that query over and over again to simplify our refresh. Acting similar to our first option, we can apply a function to a list of stock symbols and quickly bring back the quote information. Now instead of managing the queries, we are just managing a list of stock symbols. As symbols are added and removed, our data model adjusts accordingly. The result allows us to automate refreshes without having to adjust the data model in the future.
Converting a Query to a Function
Remember how I said you might need some minimal coding? That time has come. We will need to do something you may have never done before – open the advanced editor window in Power Query.
Before we do that, I do want to rename the current query to “Get-StockInfo” so it is a little easier to read. Just update the name on the query settings bar on the right. I like using the word get in front to help quickly identify it as a function versus a query.
Once you have done that, click on Advanced Editor in the home ribbon and strap in for the ride!
Step 1 – Convert the Query to a Function
Our goal is to make this function flexible for any stock symbol. That means we need to require a stock symbol to be called every time the function is leveraged.
When you open the code editor, the first line has the single word “let”. We are going to insert a row above that and put a pair of parentheses followed by an equals sign and greater than sign. This effectively makes the conversion from a query to a function.
However, we have not done anything to handle the requirement to pass a stock symbol when the function is called. To require a stock symbol be called, we will simply add a variable called StockSymbol and specify that it be passed in a text format. This will require a stock symbol be passed any time you leverage this function.
Now that we converted the query to a function and required a stock symbol be passed, it is time for us to use it dynamically with the connection string.
On line 3, you see our endpoint url and parameters that specify MSFT as our designated stock. We need to replace MSFT with our new variable. We will simply delete the current symbol, add an ampersand (&) outside of the quotes, and specify StockSymbol to concatenate the values together.
With the dynamic variable placed in the connection string, the function will now pull stock quote information based upon the symbols we have in our list.
Step 3 – Resolve Connection String Errors
If you clicked done and used this function in your report, everything would be fine inside of Power BI Desktop. However, you are going to run into an issue when you publish to the Power BI Service. Because we are using a dynamic parameter, the cloud service is not sure how to handle authentication. The result is an error in the Power BI Service and a report that will not refresh.’
To resolve this issue, we want to split our connection string to resolve this issue. We will essentially split it into two different sections. The first section will serve as the connection string and help with our authentication. The second half will be treated as a dynamic portion of the query and has no bearing on the authentication process.
In short, all we are going to do is move a portion of that connection string to prevent any errors from happening.
This is a subtle but important move. By placing the dynamic content inside the relative path, we have eliminated confusion during the authentication process. Power BI will authenticate on the connection string in place and then concatenate the relative path to complete the request. You only need to do this when your queries are dynamic, but it is an important step in the process!
Step 4 – Test the Function
After clicking done, your view in Power Query will have changed. Note that the query list now shows an “fx” symbol for function and you no longer have a tabular list of data. In fact, you have a place to enter a stock symbol. This allows us to quickly test to see if our function is working. Go ahead and enter MSFT and click invoke to see it work.
The outcome from converting a query to a function.
After you invoke the function, you will be taken to a new query called “Invoked Function” and can see the stock data for Microsoft. That was just to test and see if it works. We can go ahead and delete that query because will not need it again.
Applying the Function
With a working function in hand, it is time to apply it to our data model. I already have a list of stocks in Excel, so I will import that list to Power BI. If your stock list is somewhere else, that is perfectly fine. Just get that list of symbols inside of Power BI.
Once imported, go to your “Add Column” tab and select “Invoke Custom Function”. Select your function from the list. You will notice that the StockSymbol variable will appear. We need to specify which column of values will be passed to that variable. Select the symbol column and click OK.
Setting up the custom function to use the stock symbols from the spreadsheet.
At this point, you may be prompted about data privacy. If you do, just select ignore privacy levels for now as this is a demonstration.
You should have a new column with the word table highlighted inside of it. We can go ahead and expand those values and confirm the current stock quote info is available for each different symbol.
And just like that you created your own function and applied it in Power Query!
Next Steps
With a working function, what is left to discuss? As I stated at the beginning of this series – each API is like a snowflake. They all are unique and have their own challenges. This is a single example of how to connect a REST API to Power BI. There are challenges and other considerations you must balance when creating your reports. In my next post, I will dive into challenges you will see when leveraging other APIs inside of Power BI.
Until then, was this your first time creating a function? Did you find it challenging? Do you have other applications for a function inside of Power BI? Tell me in the comments below!
In my last article, I discussed the basics around REST APIs. We did not do anything with Power BI. While I did not get to the real purpose of this series, it was important to establish the basics. Using the elements we discussed, you can copy and paste them into Power BI to connect to your API.
For this post, I am using the Yahoo Finance API to demonstrate how this works. I do not receive any kick back for sharing this API. They have a free tier and it is a great API to use for beginners. If you want to try this on your own, you can follow along with this article.
RTFM – Read the Fine Manual
Before you do anything with APIs you must review the documentation. I worked with an API a few years ago that required a unique API key for each individual endpoint. If I had spent some time reviewing the documentation, I would have prevented hours of frustration as I tried to connect to various endpoints. If you are like me, you might find this frustrating. However, I find reading the documentation far less frustrating than constantly struggling to get an endpoint to work inside of Power BI.
Identifying Usable Endpoints
The first time I review documentation I am sorting out which endpoints are useable or not. I need to find out which API endpoints that will work with Power BI. I opened the documentation and was excited about what I saw…
Yahoo Finance API Documentation – Welcome Page
At a quick glace, all of the endpoints are using the GET connection method. As a result that means every single endpoint can be used in Power BI. That is great to see!
Which Endpoint is for Me?
Knowing what you are looking for is key when reviewing documentation. I want to find stock price information and compare prices. Quality documentation will have one of two things to help you with this process:
A data dictionary that clearly defines each column in the query
A same response from the query
Sample Response from the Quote Endpoint
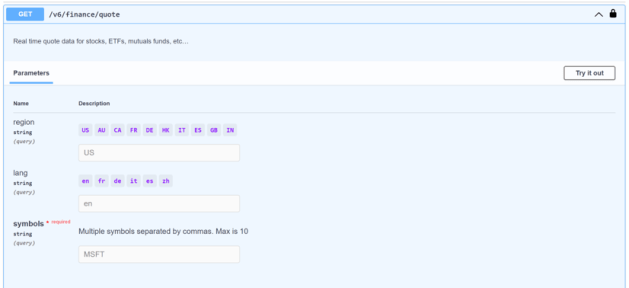
This documentation brings back a sample. As expected, I can find which endpoint meets my needs. As an example, I am interested in stock prices. According to the documentation, I can use the quote endpoint to accomplish my goal.
Setting the Parameters
Now that we have the connection method and endpoint, we need to establish what parameters are needed. Sometimes parameters are identified but not clearly documented. As a result, you might get frustrated because you cannot apply parameters to your query. This API is much easier to understand because of the clearly labeled parameters with sample inputs.
Sample Parameters for the Quote Endpoint
As you can see, the documentation provides sample values for each parameter so you know how to leverage it. This results in far less frustration because you know what values are accepted for each parameter.
Since this API has an option to try it out, I have updated the parameters to pull back Microsoft’s stock information. This allowed me to validate if my parameters were correct and saved me a ton of headaches. Since it worked, you can see that it came back with a response.
Testing Parameters for the Quote Endpoint
As a result of the test, there was another valuable bonus. The documentation assembled my connection string by putting the endpoint url and parameters together into a single connection string. How convenient!
The Connection String is Assembled Automatically
Header Information
Up to this point the Yahoo Finance API documentation has explicitly called out each of the REST API elements. However, the headers in this endpoint are not as easily identified. We have to dig a little deeper to find them.
You probably missed the box above the connection string labeled Curl. Curl is a library used to call APIs if you are developing an application. While we are not developing an application, this box does help us identify our headers. If you notice, there are two lines with “-H” at the beginning. These are the header values we have been looking for!
You have to look closely, but here are the header values we need for the quote endpoint!
Double Check
At this stage, we have identified all the elements we need for our connection in Power BI. We have the connection method, endpoint url, parameters, and headers. Remember that we are not using a POST connection method, so we do not need a body for this request. Now we just need to plug it into Power BI!
Connecting to our REST API (Finally!)
With all of our elements in hand, we can open up Power BI and start building our connection to the API.
Step 1 – Select the Web Connector
Open Power BI, select “Get Data”, and choose the Web connector:
Step 2 – Copy/Paste Elements into Power BI
First things first – switch to the advanced mode for the Web Connector so you can add all of the required details.
Using the Advanced Web Connector view in Power BI
You will notice that there is no option to select your connection method in this view. Power BI defaults this to GET, so you do not need to configure anything. One less thing to worry about!
Go back to the documentation and copy your connection string. If your documentation does not assemble this for you, you might need to do this by hand. Once assembled, paste it into the URL Parts box in the web connector.
Highlighting where the Connection String (endpoint url and parameters) goes in the Advanced View of the Web Connector for Power BI
Next, we can add the headers. This endpoint has two – Accept and X-API-KEY. You will only see one set of boxes at the bottom. You can simply click “Add header” to accommodate for the second header.
For the Accept header, we can select it from the drop down on the left as it is a commonly used header. On the right, copy and paste the value found in the API documentation.
For the X-API-KEY header, you can enter your own value in the drop down or copy/paste it from your documentation. You can copy your API key from the documentation as well into the box on the right.
Highlighting where the headers go in the Advanced View of the Web Connector for Power BI
By bridging the documentation with the web connector, we have successfully filled in all of the blanks for the connection method, endpoint url, parameters, and headers. With everything in place, we can click okay and connect!
Step 3 – Authentication
Since this is the first time we are using this connection, we are prompted to select an authentication method. If you are using the Yahoo Finance API, you can easily select Anonymous and click connect as our API key handles our authentication.
Authenticating with the Power BI Web Connector
On the left, you can see there are other authentication methods. Sometimes your connection method will require a username and password. I have experienced this with ServiceNow and Honeywell APIs. If you are adventurous and want to try using the Microsoft Graph API, you will need to use your organizational account. You will need to review your documentation to determine if you need to use other forms of authentication to use an endpoint.
Transformation Time
By following these steps, you should now see your stock data inside of Power Query. All of the information you saw in the sample response should be in a tabular format and ready to go. For an easier view, I made some adjustments so you could easily compare the values:
Data from the quote endpoint
With this query in place, you can quickly refresh the data and will always have up to date stock quote information for Microsoft.
Next Steps
With everything connected, you probably think we are finished. If there was only one stock we cared about, we would be in good shape. However, investors are looking at several different stocks each and every day and this query only pulled one. In my next article, I will show you how to scale this query so whether you have 10 or 1,000, you will have a maintenance free report that always refreshes.
Until then, did you follow along with the Yahoo Finance API? Were you able to get some valid data? Tell me in the comments below!
We have all been there once before. We are using a 3rd party tool and we want to extract data from it. You might have an option to export the data to a CSV or Excel file, but that requires you to be involved and can result in errors.
Next you might reach out to the support team and they send back documentation for their APIs. They think you are a programmer and probably know how to use them. But in a world full of citizen developers not everyone knows how to use these APIs to bring data into Power BI.
This series aims to demystify the process and start getting that data into Power BI and eliminate those data exports. And believe it or not, it will require a minimal amount of code to make it happen!
What is REST?
REST APIs (also known as RESTful APIs) is a specific architecture of an Application Program Interface (API). Known as the Representational State Transfer (REST), it has a standard set of rules that are widely used in the programming world. It scales well and has become a commonly accepted API that is stable. REST APIs fill a specific need to simplify integration of data between different applications.
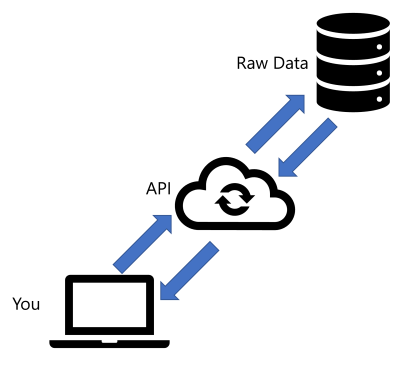
API requests are fairly straight forward. It starts with a request from you (the client) to an API endpoint. After being authenticated, the request continues on to a database with the data you need. That data is returned back to the endpoint where it is formatted and then passed back to the client.
The flow of requests with REST APIs
For many, this flow makes a ton of sense. However, if you are not from a programming background, this can be a little intimidating. When you read API documentation, it is often full of code snippets and it can be difficult for you to get started. Sorting through these snippets and figuring out how they work can be complicated and time consuming.
But here is the good news – Power BI can handle these API requests often with no code required! The trick is understanding how REST APIs are structured and then plugging the information from the documentation into the right place.
Anatomy of REST APIs
So if we can take the documentation and plug it into Power BI, it is important to understand how REST APIs are constructed. Once we understand the anatomy of an API, it becomes easier to connect via Power BI. There are five common elements that are leveraged with REST APIs:
Method
Endpoint URL
Parameters
Headers
Body
You will always need a Method and Endpoint URL when using REST. However, the other elements will vary based off of the documentation. You will have to read your documentation carefully to make sure you have everything you need.
To better understand these elements, let’s take a look at them individually to understand what they do and how they work.
Method
There are four methods that are used with REST APIs: Get, Post, Put, and Delete. Methods help instruct what is happening when the API is called. For example, if you called a Delete method, you would be deleting content on the server.
Sample methods used with REST APIs
To make our lives easier, the Get method is the most common one we will use and is the easiest to implement. Post can be used sometimes, but it requires a little more effort and coding in Power Query to make it work. You will never use Put or Delete in Power BI.
Endpoint URL
The Endpoint URL determines which specific API we are calling. There will be multiple APIs available, so it is important to determine which one you need. In reviewing your documentation, you should be able to determine which endpoint contains the data you need to query.
Sample of an Endpoint URL
Parameters
Parameters filter the results of your request. Notice the “?” that separates the connection string. Before it is the Endpoint URL while after are the parameters. Multiple parameters are separated by ampersands (&) and strung together.
Sample of Parameters tacked on to an Endpoint URL
Parameters speed up requests as they reduce the amount of data requested. Often optional, but sometimes required. The API documentation will specify if any parameters are required.
Headers
Headers are designed to pass information about your request. The most common header you will need is an API key or token but you may run into others. Another common header you might need to identify is the Content-Type to specify how we want to see our response.
Sample of REST API Headers
Body
Since we are using the Get method primarily in Power BI, you will not need the body. However, it is worth mentioning it in case you use a Post method in the future. The body is another set of parameters to assist with the request.
Documentation is your friend
If you are like me then you hate reading directions. I love working through things on my own and discovering. But after many lost hours, I have learned to take a few minutes to read the documentation that comes with an API first. It takes time, but there are several reasons to take a few minutes and understand how the API functions.
Sample of REST API documentation for Yahoo! Finance
Reason #1 – Each API is like a snowflake
Every API is unique and has their own requirements. You will find some that require certain parameters to be declared. Others might need a token. I even worked with one that required a different API key for each endpoint! Understanding the components of our API will reduce headaches as we go to use them.
Reason #2 – Ensure you are receiving the right data
The best documentation is paired with a dictionary to help identify the data being returned. You may need two or three APIs to get all the information you need. Taking a few minutes to understand what data is available will help you build a plan as you build your connections.
Reason #3 – Try it out
Often APIs have an option to try them out. You can select an endpoint, fill out the parameters, and then submit the request. It brings back a sample of the data and even will assemble the connection string and headers for you. It also helps identify any required parameters and diagnose issues before you move into Power BI.
Next Steps
Now that we understand the basics around REST APIs, the next step is to transfer what we have learned into Power BI. You might be wondering why I took the time to understand the basics of REST APIs. As I mentioned before, many of these APIs can be used with no code. With a strong understanding of how they are built, we can copy/paste these elements into Power BI and start querying data. In my next post, I will show you how to connect to the Yahoo Finance API to query stock quotes in real time.
Until then, have you used any APIs in Power BI? Do you have any favorites that you like to use? Tell me in the comments below!